
I started working in web analytics in early 2011 at a large independent advertising agency. Our clients had marketing websites and we had to see how effective marketing campaigns were once they clicked through on a piece of advertising. Print and billboards were pretty straightforward transactions. You paid a set amount of money and were told the publication has 18,000 monthly subscribers, or that a billboard gets 227,000 drive-by traffic a month. Websites were more unpredictable and could reach more eyeballs than ever, but you had to track and measure. We quickly learned every page visit counts, but not all types of sessions and events are created equal.
Today I will do a quick dive into our action score formula and how you can use it to find the best traffic sources and convert more followers into loyal fans.
Let's play ball!

Table of Contents
Table of Contents
WARNING this is only going to briefly get a little nerdy...but to be fair then it's going to be some sports talk. ⚾️
Sabermetrics is the study of baseball statistics that measure in-game activity. It was popularized by the book "Moneyball," which highlighted the use of advanced baseball statistics to identify undervalued players and assemble a competitive team on a small budget. Even though I read the book two decades ago, I have often thought about how empirical analysis could be used in other areas we often measure.
In the context of a Campsite.bio profile, again it is important to understand that not all events are created equal. For example, a user filling out a form and opting in to receive emails is more valuable than a user simply scrolling through a page.
What is a Slugging Percentage?
To score your followers' behavior we have deployed a formula comparable to a baseball slugging percentage.
In baseball, slugging percentage (SLG) is a statistic that measures the power of a player. It is calculated by dividing the number of bases a player has gained on hits by the number of at-bats. The resulting number is then multiplied by 100 to express it as a percentage.
A player's slugging percentage is a measure of how often they can hit the ball hard and get extra bases. A player with a high slugging percentage is typically a good power hitter who can hit home runs and doubles regularly. On the other hand, a player with a low slugging percentage is typically a player who doesn't hit for much power and may rely more on singles and stolen bases to score runs.
To calculate a player's slugging percentage, you use the following formula:
SLG = (total bases / at-bats) * 100
For example, if a player has 60 at-bats and hits 10 singles (1 base each), 4 doubles (2 bases each), 1 triple (3 bases), and 1 home run (4 bases), their total bases would be 60 (10 + 8 + 3 + 4) and their slugging percentage would be:
SLG = (60 ÷ 60) * 100 = 100
This means that the player was able to hit for an average of 1 base per at-bat, which is considered a good slugging percentage.
Meet the "players"
To see who your big sluggers are and measure performance Campsite.bio considers a traffic source (referral) a "player". They can have multiple at-bats in a given week or month, and we score how those at-bats compare to other traffic sources.
For a real-life example let's say PLAYER ONE is Instagram which had 12 sessions (at-bats), 2 scrolls, 2 clicks, and 3 email opt-ins
Box Score
(1*2 scrolls) + (2*2 clicks) + (4*3 email opt-ins) = 18 bases
Instagram ACTION SCORE = (18÷12)*100 = 150
PLAYER TWO is TikTok 19 which had 19 sessions (at-bats), 3 scrolls, 3 clicks, and 3 video starts.
Box Score
(1*3 scrolls) + (2*3 clicks) + (3*3 video starts) = 18 bases
TikTok ACTION SCORE = (18÷19)*100 = 94.73
This shows a clear winner, even though TikTok had more sessions, not as much happened.
Plate Appearances
We liken each session on your Campsite.bio profile to an "at-bat," and we track how many "bases" a user touches during those sessions. For example, a user filling out a form and opting in to receive emails is considered a "home run," while a user only scrolling through a page is scored as a "single." If an at-bat has a scroll, click, and form submit we award the highest base reached (form submit).
We segment these by traffic source to see which ones add the most value to your organic marketing lineup. By analyzing this data, you can identify the most valuable players on your roster and tailor your organic marketing strategy to attract more of these users.
Action Score Formula
Here is our scoring system that assigns bases for different events:
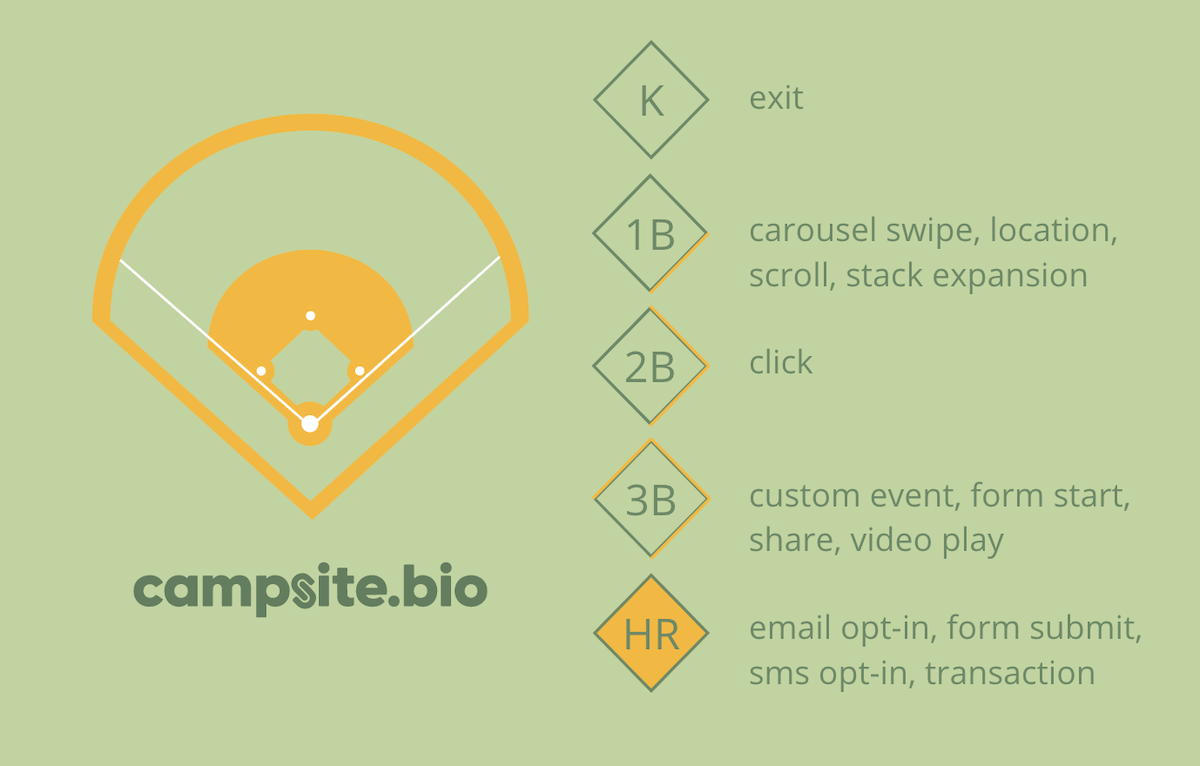
Total scrolls, carousel swipe, stack expansions, & location clicks
Total scored clicks
multiplied by 2
Total custom events, form starts, share clicks, & video starts
multiplied by 3
Total email opt-ins, form submits, sms opt-ins, & transaction
multiplied by 4
We have some cool ideas on how to extend this scoring to your GA4 web analytics too.
This scoring helps you understand which posts (see our new channel report) and referrals are driving the most action and value to your business. Focus your efforts on attracting users who are most likely to take these actions.
Campsite.bio would love to be your performance tracking partner 🤝. As always let us know your thoughts.